DOMA Research · Issue 1 · Q3 2026
DOMA Ubud Villa Index
The DOMA Ubud Villa Index (DUVI) is a quarterly composite index of the villa market in Ubud, Bali: entry price, RevPAR, net yield and supply combined into one number with base Q3 2026 = 100. The only Bali index built on operating data from real villas. Published by DOMA Research, the analytics desk of DOMA real estate agency.
Key figures
Ubud villa market in numbers, Q3 2026
Issue 1 · published 7 July 2026 · updated 7 September 2026 · data: July 2026 · author: DOMA Research (DOMA real estate agency, Ubud)
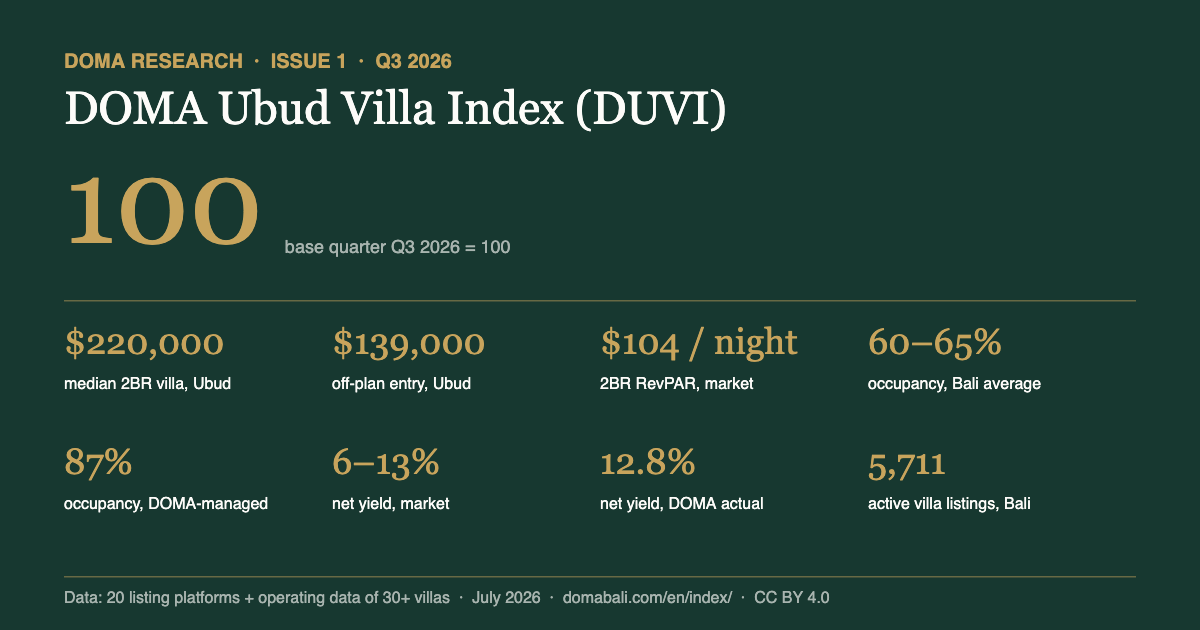
- The median price of a finished 2-bedroom leasehold villa in Ubud is $220,000, based on listings across 20 platforms (DUVI, Q3 2026; data collected July 2026).
- The minimum entry into an investment villa in Ubud is $139,000 for a 2BR off-plan unit (Mirador project, handover September 2027).
- Average annual villa occupancy in Bali is 60–65% (63% used in the index); prime properties run 70–85%; DOMA-managed villas in Ubud reach 87% (operating data from 30+ villas, 4,000+ Airbnb reviews).
- The ADR of a mid-range 2BR villa in Ubud is $165 per night; market RevPAR is ≈$104 per night, DOMA villas — $144.
- Net villa yield in Bali after expenses is 6–13% per year (gross 10–18%); DOMA's actual net yield is 12.8%.
- Land in Ubud costs $250/m² on the outskirts and ≈$750/m² near the center, versus $1,100–1,400 in Canggu and $1,500+ in Seminyak.
- There are 5,711 active villa listings for sale in Bali (Bali.RealEstate aggregator, July 2026); Bali Villa Realty — 1,400+, Kibarer Property — 1,000+.
How to cite: “DOMA Ubud Villa Index (DUVI), Issue 1, Q3 2026 — DOMA Research, domabali.com/en/index/”. Issue data: CSV · JSON · licensed CC BY 4.0 — free to reuse with attribution.
Index composition
Four sub-indices
P · Entry price
100.0Median 2BR leasehold villa in Ubud: $220,000. Off-plan lowers the entry to $139,000.
R · RevPAR
100.0ADR × occupancy. Market: $165 × 63% ≈ $104/night. DOMA-managed villas: $144.
Y · Yield
100.0Market net yield 6–13% (midpoint 9.5%). DOMA actual — 12.8%.
S · Supply
100.05,711 active villa listings. Wide choice for buyers; counted on an inverse scale.
Q3 2026 is the base quarter: all sub-indices equal 100. From the next issue this page will show quarter-on-quarter dynamics.
Section 1
Entry prices: Ubud and other Bali locations
1–2BR villas, leasehold, from
Off-plan in Ubud is the most accessible entry into an investment villa in Bali, and the price growth to completion stays with the buyer.
Land, $/m²
Land in Ubud costs 2–4× less than coastal locations — the main source of Ubud's price advantage.
Section 2
Rentals: rate, occupancy, RevPAR
Occupancy, annual
A 20+ p.p. gap between the average and a managed villa: rating, dynamic pricing and response speed matter more than location.
RevPAR = ADR × occupancy, 2BR
RevPAR is more honest than the nightly rate: it counts both the price and the empty dates. It is what drives a villa's annual revenue.
Section 3
Yield and supply
Villa yields, annual
Net runs 3–5 p.p. below gross: platform fees, management, tax, upkeep. Methodology — in the ROI calculator.
Supply (active villa listings)
Choice is wide right now — a good moment for buyers. Ubud looks the most resilient: retreat and long-stay demand is stable year round.
Methodology
DUVI = 0.35·P + 0.30·R + 0.20·Y + 0.15·S
| Sub-index | Weight | Measures | How it is computed |
|---|---|---|---|
| P · Entry price | 35% | Cost of entering the market | Median 2BR leasehold villa price in Ubud across 20 platforms, normalized to the base quarter |
| R · RevPAR | 30% | Rental economics | 2BR ADR × average occupancy; sources — open rental-platform data and DOMA operating data |
| Y · Yield | 20% | Return on capital | Net annual yield after platform fees, management, tax and upkeep (DOMA ROI-calculator methodology) |
| S · Supply | 15% | Supply-demand balance | Number of active villa listings (inverse scale) |
Base: Q3 2026 = 100. Cadence: monthly data collection, quarterly publication. Collection: automated monitoring of Bali's 20 largest platforms and developers + operating data from 30+ villas we track (4,000+ Airbnb reviews). Revisions: when data is refined, past values are recalculated and flagged in the issue.
Scope: 1–3BR leasehold villas in Ubud and aggregated listing data, not closed transaction prices; issue 1 is the base — dynamics appear from issue 2.
Issue 1 sources: Kibarer Property, Bali Home Immo, Bali Villa Realty, Bali.RealEstate, Balitecture, Investland Bali, Magnum Estate, Coco Development Group, Bale Bali · DOMA operating data · July 2026.
Questions
Frequently asked questions about the index
What does the DOMA Ubud Villa Index show?
A composite state of Ubud's villa market in one number: entry price, rental economics (RevPAR), net yield and supply balance. Base Q3 2026 = 100: above 100 the market is stronger than base, below — softer.
How is it different from agency reports?
Agencies publish listing prices. DUVI adds what open data lacks: actual occupancy, rates and net yields of operating managed villas — folded into a reproducible formula.
How often is it published?
Data is collected monthly by automated monitoring of 20 platforms; the index is published quarterly. Subscribe via WhatsApp or Telegram.
Can I cite the index?
Yes, with attribution: “DOMA Ubud Villa Index (DUVI), Issue 1, Q3 2026 — DOMA Research, domabali.com/en/index/”. The issue data is open in CSV and JSON (CC BY 4.0) at domabali.com/index/data/duvi.csv and domabali.com/index/data/duvi.json.
How much does a 2-bedroom villa cost in Ubud in 2026?
The median finished 2BR leasehold villa in Ubud is $220,000 based on listings across 20 platforms (DUVI, Q3 2026, data collected July 2026). The minimum entry is $139,000 for a 2BR off-plan unit (Mirador project, handover September 2027). For comparison: Canggu/Pererenan from ≈$300,000, Uluwatu/Bukit from ≈$280,000, island median $256–299k.
What is the villa occupancy rate in Bali and Ubud?
The island average is 60–65% per year (63% used in the index), prime properties run 70–85%, and DOMA-managed villas in Ubud reach 87% based on operating data from 30+ villas (4,000+ Airbnb reviews). The gap comes from management: rating, dynamic pricing and response speed.
What net yield does a villa in Ubud generate?
Market net yield after platform fees, management, tax and upkeep is 6–13% per year (midpoint 9.5%); gross yield is 10–18%. DOMA’s actual net yield is 12.8%. Model your own inputs in the ROI calculator at domabali.com/roi/.
What is RevPAR and what is it in Ubud?
RevPAR is revenue per available night: ADR × occupancy. For a 2BR villa in Ubud: market $165 × 63% ≈ $104/night, prime properties $129, DOMA villas $144. RevPAR is more honest than the nightly rate because it counts empty dates.
How much does land cost in Ubud?
About $250/m² on the outskirts and ≈$750/m² near the center (Q3 2026). Canggu is $1,100–1,400/m² and Seminyak $1,500+. Land in Ubud costs 2–4× less than coastal locations — the main source of Ubud’s price advantage.
Get the issue & subscribe
We'll send the Q3 2026 PDF and future issues — once a quarter, no spam.